Study design
Study design
There are two main classifications of study designs: one where the investigator takes a passive role in observing events (observational study) and the other where the investigator applies an intervention and examines its effects (interventional study). The randomized controlled trial is often regarded as the gold standard for establishing causality, but there are also many situations where an observations study may be a better choice (e.g., in studying rare outcomes of interest). The main limitations of
observational studies are issues of bias and confounding. Confounding occurs when there is a factor that is related to the independent and dependent variables and thus affects the outcomes of the study. For instance, those who use tanning beds may participate in other high-risk activities such as drinking, smoking, or poor eating habits, all possible confounders that must be accounted for. Approaches to controlling for confounding include individual or group matching and stratification or adjustment during data analysis. Bias is any error in the study design, orchestration, or analysis that results in an error of inference. Selection, interviewer, recall, and performance bias are all common examples. An overview of study designs and considerations for when to choose the most appropriate design is presented below.
Observational studies An observational study may be either descriptive, for example, where distributions of a disease or an exposure are described (e.g., describing trends in basal cell carcinoma incidence3), or analytic, where associations between predictors and outcomes are examined. Analytic studies are designed to test a hypothesis. Analytical observational studies can be of three types, depending on the time sequence and sampling procedures used to collect data: case-control, cross-sectional, and cohort studies (Table 11-2).
Case-control study. A case-control study is a retrospective observational design that observes patients who have been diagnosed with a specific disease or outcome compared to control patients, and examines the association with a certain exposure (Fig. 11-1A). Outcomes are reported as odds ratio (OR), which is defined as the odds of having a disease if you have a specific exposure. For example, a study examining patients with squamous cell carcinoma (SCC, cases) compared to those without SCC (controls) showed that those with SCC had a fourfold higher risk of having had a family history of SCC.4 These data were derived via questionnaires, and like most
retrospective studies that utilize patient recall, are subject to recall bias as well as confounding by unmeasured variables (in this particular case, shared familial environmental exposures, such as family beach vacations)
Cross-sectional study. A cross-sectional study examines a population in a given timeframe and provides information regarding the prevalence of disease in subjects that have a given exposure compared to the prevalence of disease in subjects that have not had the exposure (Fig. 11-1B). An example relevant to dermatologic surgery is a crosssectional study that demonstrates an association between the location of an atypical melanocytic proliferation on the head and neck, and positive margins after excision.5 Because the exposure and the outcome are determined at the same time, it is not possible to determine temporal relationships between the two.
Cohort study. A cohort study follows a group of individuals with a common disease or exposure over time (Fig. 11-1C). The investigator selects a group of patients that have already been exposed to a treatment or procedure and compares an outcome of interest to an exposed group. There are two forms of cohort study: prospective and
retrospective. A prospective cohort is one where the participant is exposed to the variable at a time when the study begins or in the future, and then is followed into the future to determine outcomes. A prospective cohort study is useful for determining potential causes of a condition, and is best suited for common conditions, or within a targeted population for rare conditions. Examples of prospective cohorts include the Health Professionals Follow-Up Study (HPFS) and the Nursing Health Study (NHS), who were followed prospectively from 1984 to 2008 and studies of those with a history of NMSC were found to have significantly higher risk of other primary cancers.6
Relative risk (RR) is defined as the risk of developing one condition if the exposure is present relative to the risk of another group without exposure. An RR of 1 implies there is no difference between groups, greater than 1 implies that the condition is more common in the experimental group, and an RR less than 1 suggests that the condition is less likely in the experimental group. RR, unlike OR, demonstrates temporality.
In contrast to a prospective cohort study, a retrospective cohort study identifies individuals that had exposure in past (typically via chart review or databases) and measures outcomes at some defined time (such as study start time or a time in the future) (Fig. 11-1). Outcomes for both can be measured in RR, hazard ratio (HR), OR, standardized incidence ratio (SIR), or standardized mortality ratio (SMR).
SIR is used to determine whether incidence of disease in a small population is high or low, while SMR is a similar measure for incidence of death. For example, a retrospective cohort study design was used to examine the association between histopathologic risk factors (poor differentiation, perineural invasion, tumor diameter ≥2 cm, invasion beyond subcutaneous fat) and outcomes including death and nodal metastasis from 256 high-risk cutaneous SCCs.7 The benefit of a retrospective cohort study is that it can be conducted on a smaller scale requiring less time and resources to complete, can more easily examine multiple outcomes, as well as rare outcomes. Depending on the research question, a retrospective cohort study design may be a good approach for dermatologic surgeons performing clinical research.
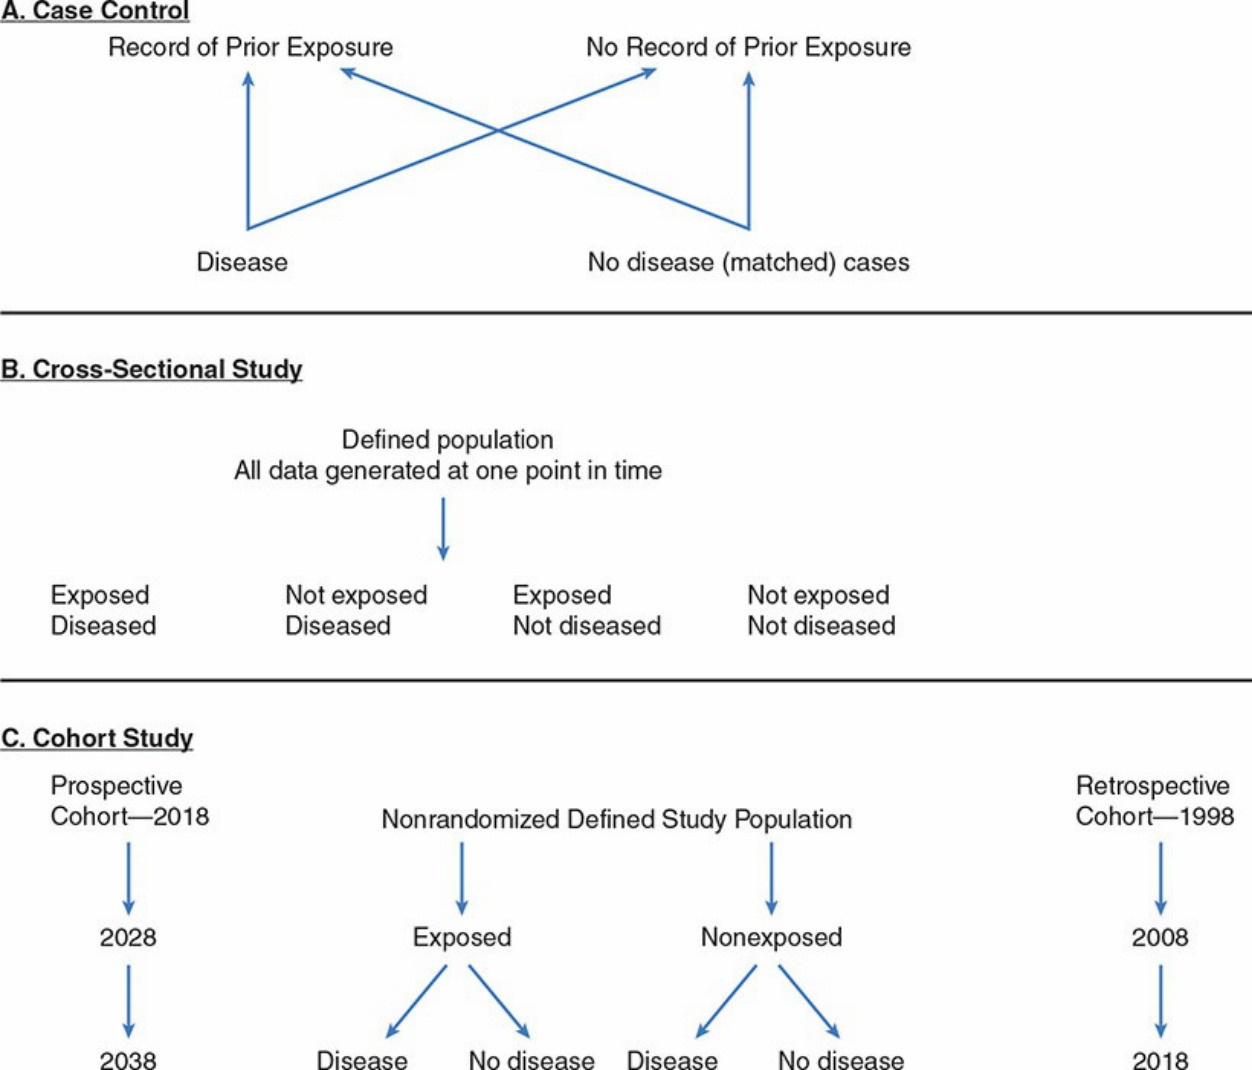
Figure 11-1. A. Case-control study model. B. Cross-sectional study model. C. Prospective vs. retrospective cohort studies.
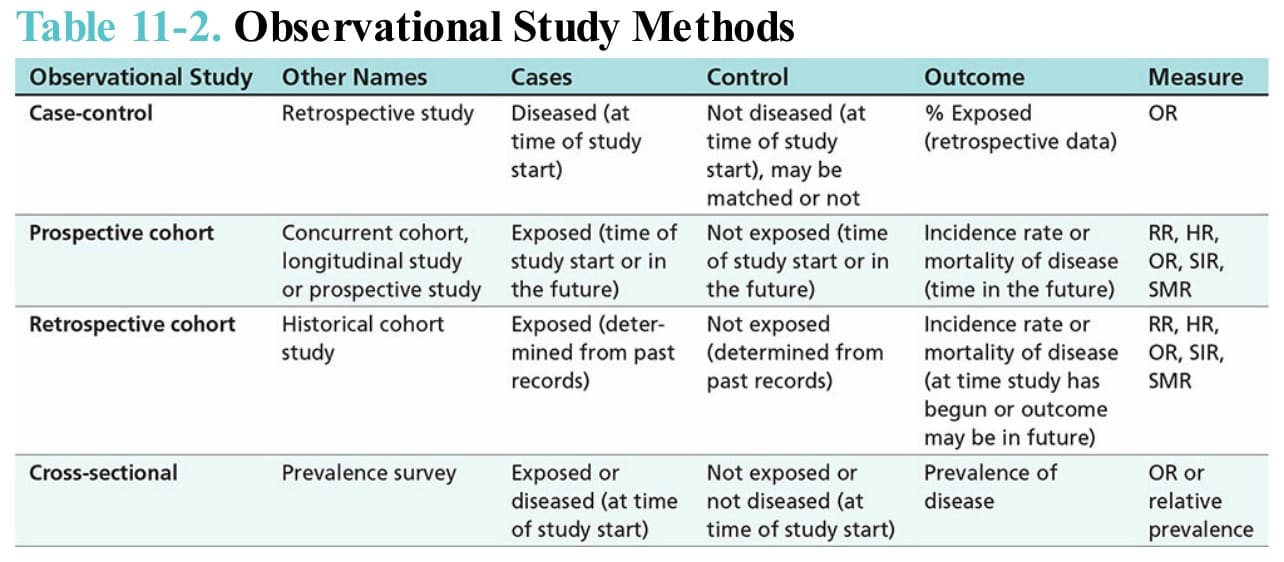
Table 11-2. Observational Study Methods